
Year-end Analysis Using Charts and Graphs – Business of Doing Business – The Journal of Antiques and Collectibles – March 2006
By Ed Welch
Every January I spend a few days analyzing my sales of the previous year. I compare total sales with sales of past years. I compare my monthly sales with monthly sales for the past five years. I look at each of the nearly 60 items I carry to see how well each item sold when compared to sales figures for the last three years.
I try to answer questions such as, did item number one result in more sales in 2005 then in the previous three to five years? How much profit did I make on item number one? Has my profit margin on item number one increased or decreased in the past five years. Is item number one becoming harder to find? Does item number one sell quickly?
I spend many hours analyzing product turnaround time. I prefer to carry items that sell in 90 days or less. I will carry items that require 180 days to sell. I do not carry items that stay in stock more than 365 days, unless the profit margin on these items is huge.
As a professional antiques dealer, I deal in both ends of the marketplace. I carry expensive investment grade antiques and I carry low-end collectibles and outright junk. Over the years, I have made much more money dealing in collectibles and flea market items.
I use charts and graphs to analyze my business. At one time, I made charts by hand. Today, accounting program such as QuickBooks will generate a chart or graph with the press of one button. In total, I generate nearly 100 charts and graphs. I tack the charts on the walls of my office and warehouse, stack them in piles on my desk, and arrange them in rows on my office floor.
If sales and profits are up, as they were in 2005, I want to know why. What did I do differently to generate more profit? If sales and profits are down, I want to know why. Did I fail to purchase the right items? Did I fail to add enough mark-up to generate the profit I need to support my family?
The remainder of this article will be an examination of charts that I generate each year. I find it difficult to write about price markup and the selling of specific antiques without naming the antiques and giving sales figures and markup percentages. However, I am not willing to give away my personal business information for the sake of making points in an article.
This is a simple chart showing the total sales for the years 1997 through 2005. Notice that there is a spike in sales for the year 2000. The reason for this spike is that I purchased and resold a collection. The collection consisted of nearly 1,000 low-end flea market pieces.
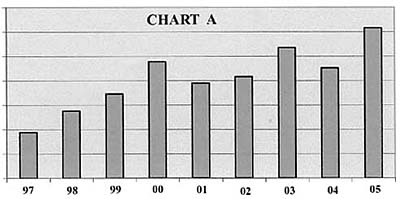
The year 2004 shows a substantial decline in sales. This was the result of my inability to buy the types of items I carry at prices low enough to allow for a profit. Brimfield dealers who normally sell items to me either did not have them or wanted too much money for the items I buy. This was also true of other large shows, such Madison Bouckville. My annual buying trip to the UK was not as productive as in earlier years. In addition, although I bid on several estates and collections, I was constantly out bid by dealers and auctioneers willing to pay more.
The year 2005 is the best-selling year that I have ever had. I set records for total sales. I also set records for profits. The major reason for such high sales is that buying at Brimfield and other large shows was better than it had been for several years. Prices for the things I normally buy were down between 25 and 50 percent. See The Journal of Antiques And Collectibles, December 2005, Page 12, “How to Make Money in a Down Market.”
I call chart “A” my feel good/feel bad chart depending on whether or not this year’s bar is higher or lower than that of the previous year. Chart “A,” by itself, has little value as a business tool. Its usefulness is to confirm what I already know. I’m having a better or worst year than last year. It does not answer the question why.
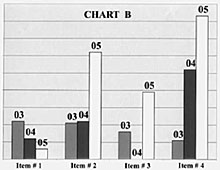
This chart shows yearly sales for four of the sixty items that I normally carry:
Item #1 is an item that I have carried for the past 20 years. This item is becoming harder to find at prices that allow for a profit.
Item #2 is a rare and expensive antique. Last spring I purchased a collection that contained several such items. The collection also contained many other rare and hard to find the antiques, all of which are expensive. Fortunately, I was able to resell enough of this collection within 90 days to repay the small-business loan needed for its purchase. The increase in sales for the year 2005 for this item is a direct result of buying the collection.
Item #3 is an antique that is rare and hard to find. This item is fast selling if the selling price is kept below a certain figure. I was not able to purchase a single such item in the year 2004 but I bought several such items in 2005. Most were purchased at Brimfield. In addition, two came from the same collection as item #2.
Item #4 is a new item to my inventory. I became interested in this collectible early in 2003 because of watching a documentary show on television. I bought several books on the subject. I studied auction results, the selling patterns from eBay, and spoke with dealers who normally carry this item. I became convinced that I could not make money buying and reselling this item within the antique trade. However, I knew that an active retail market existed. I developed a market not associated with the antique trade. In plain English, I buy this item wholesale in the antique trade and sell to retail vendors not associated with antiques. This is a common readily available collectible. I hope to be able to keep this niche business active for several years.
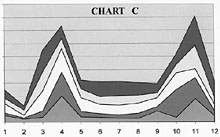
This chart shows total sales figures by month. Notice that the second month, February, is my slowest selling month. I spend most of February in Europe each year buying a container full of antiques. Sales begin to pick up in March. Sales reach a high point in April then fall in May. From May through September, my sales are constant. Another spike in sales begins in October and reaches its peak in November. Sales fall back in December.
This chart depicts my sales for the years 2001 through 2005. Each shade is a different year. The bottom shade represents the year 2001. The top shade represents the year 2005. Monthly sales very within each year. Notice that October sales in the year 2001 took a big dip. Also, notice that the middle shade that represents the year 2003 is thicker. This indicates that I consistently sold more items each month in 2003.
As I said earlier in this article, the year 2005 was my best year ever. The top shade, which represents 2005, clearly shows by its thickness that I sold many more items each month. I sell my low-end antiques, collectibles, and junk 12 months a year. The consistent buying and selling of such items is my paycheck. Profits from the sale of low-end items make my house payments, car payments, medical insurance payments, pay my heating bills, light bills, and puts food on my table. Most years, the sale of low-end items also buys my wife and I a two-week vacation away from the antique trade.
Twice each year, the first week in April, and the first week in November, I sell investment grade antiques and other rare and expensive antiques that I have been able to acquire. The sale of such items is a private sale. I sell only to my customer base. Attendance is by invitation only. Generally, I rent a hotel suite with an adjoining boardroom. The boardroom becomes my selling site. Because I do not need locked display cases, I can create attractive displays that include small expensive items.
One month before each sale, I create a color catalog that looks very similar to a fine auction catalog. I mail this catalog to customers who are likely to buy the items I have acquired since my last sale. Many of my customers want every catalog I produce, whether or not it contains items they are likely to purchase. I have other customers who want catalogs only if I have found something they collect. Eighty percent of customers who attend my private sales are collectors; fifteen percent are dealers who resell the items they buy from me. Generally, I sell 90 percent of everything I offer for sale. I take the unsold items from my private sale along with similar items of lesser value to an antique show in Charlotte, North Carolina. At this show, I usually sell the remainder of my fine antiques along with much of the lesser value items that I have purchased since my last show. I have tried, without success, to create a third private sale. However, I have not been able to find enough high quality antiques to support such a show.
In addition to tracking sales with the use of charts, I also track percentage of profit produced by each item, turnaround time in days, and item productivity. How productive is any given item in my inventory. Does it rank close to the top of the 60 items I normally carry in generating profits or, is it close to or on the bottom of the list. I use this information to cull slow moving and less profitable items from my inventory. This frees up money that I can use to buy items that are more profitable.
Maintaining an inventory of fast selling highly profitable items is key to a profitable antiques business. Finding new items to add to an inventory and culling less profitable items is a chore that every antique dealer must perform on a regular basis. Making decisions on which items to add to inventory and which items to delete from inventory cannot be left to emotions, whim, or fancy. Such decisions are the foundation of a good business and must be made using reliable and accurate information. The use of charts and graphs based on actual sales history provides convincing proof of an items productivity. If an item is not pulling its own weight or, costing my business money, this will show up in the charts.
Many business owners can look at a spreadsheet or profit and loss figures and know how well their business is doing. I need something more graphic, more visual. Charts and graphs allow me to see the up and down swings that my business normally goes through. Charts and graphs call my attention to highs, lows, and static periods. Charts and graphs highlight problems, trends, and sudden changes. I highly recommend their use to small business owners, especially antique dealers.

Sponsored

Related posts: